
What Is a Rent Index?
A rent index is a statistical tool that tracks the average cost of residential or commercial rental housing over time within a given area. It functions as a benchmark for measuring rent inflation, assessing market trends, and informing housing policy. While indexes may vary in structure depending on the source, their primary goal remains the same: to offer a consistent reference point for how rental prices are moving relative to past periods.
Rent indexes are typically built using repeated observations of rental prices over time, either through direct survey data, rental listings, or reported lease contracts. Some indexes rely on advertised rents, which may skew toward new leases and higher market turnover, while others try to track in-place rents by surveying landlords or using housing panel data. The methodology matters, because it determines how sensitive the index is to short-term market changes versus long-term trends.
In many countries, rent indices are key components of the overall consumer price index (CPI), as housing often makes up a large share of the total household expenses. Changes in the rent index can impact inflation reporting, cost-of-living adjustments, and even monetary policy decisions.
Other examples of groups that use rent indices are private real estate investors and institutional landlords, who use them to benchmark performance, project cash flows, and make allocation decisions.
Construction of Rent Indexes (Rent Indices)
There is no single rent index methodology. Broadly speaking, they fall into two camps: contract-based and advertised-rent based.
Contract-based indexes attempt to track the rents actually being paid by tenants over time. This includes in-place leases, which reflect long-term agreements, annual adjustments, and local regulations such as rent control. The advantage here is accuracy (what tenants really pay) but it comes with a lag. These indexes don’t react quickly to sudden changes in market conditions, because they’re observing slow-moving data.
Advertised-rent indexes pull from listings: online platforms, classified ads, broker submissions, etcetera. These offer more responsive data, but they suffer from selection bias. For instance, units listed for rent in a certain area can have a tendency to be higher-priced or newly renovated, compared to the average. It is also important to remember that listing prices are not always the same as the final lease agreement. Landlords can advertise a high asking rent but settle for less, and advertised rents can also trail behind actual concessions or promotional discounts not shown in the data.
Some indexes blend both methods. They attempt to correct for sampling bias by using hedonic regression models or repeat-rent observations on the same units over time. But the limitations of the underlying data are always there. It’s not possible to fully observe the rent market without full lease disclosure, and few regions mandate that level of reporting.
Why Rent Indexes Matter
At the most basic level, a rent index tells you whether it’s becoming more expensive or more affordable to rent in a given area. For tenants, this frames decisions around lease renewal, relocation, or budgeting. For landlords, it influences pricing strategy, tenant turnover management, and capital investment planning.
Policymakers use rent indexes to evaluate the effectiveness of housing regulation. A steady rise in the index may indicate housing shortages, insufficient construction, or weak rent control enforcement. A stagnant or falling index, on the other hand, may reflect economic stagnation, demographic decline, or overbuilding.
In macroeconomics, the rent index plays a large role in inflation measurement. Since housing is one of the largest components of CPI in most developed economies, even modest changes in the rent index can shift inflation figures significantly. In countries like the U.S., the “owners’ equivalent rent” subcategory (based in part on rent index methodology) carries enough weight to influence interest rate policy.

Examples of Rent Indices
The U.S. Consumer Price Index (CPI) for Rent
The U.S. Consumer Price Index (CPI) for Rent tracks the price of housing for renter in the U.S. and provides a broad measure of rent inflation. It is a key component of the overall U.S. CPI and widely used in economic analysis. For the average landlord or local policy maker, it tends to be too broad to be really useful (at least on its own), since it is a nation wide index and the housing markets within the U.S. are known to be extremely varied.
The U.S. CPI for Rent refers primarily to two components tracked by the Bureau of Labor Statistics (BLS):
- Rent of Primaryy Residence
- Owners’ Equivalent Rent of Residences (OER)
Rent of Primary Residence measures actual rents paid by tenants for the home they live in, and the numbers are collected from rental units across the U.S. The OER reflects the imputed rent homeowners would pay to rent their own home, and is therefore only a statistical estimate.
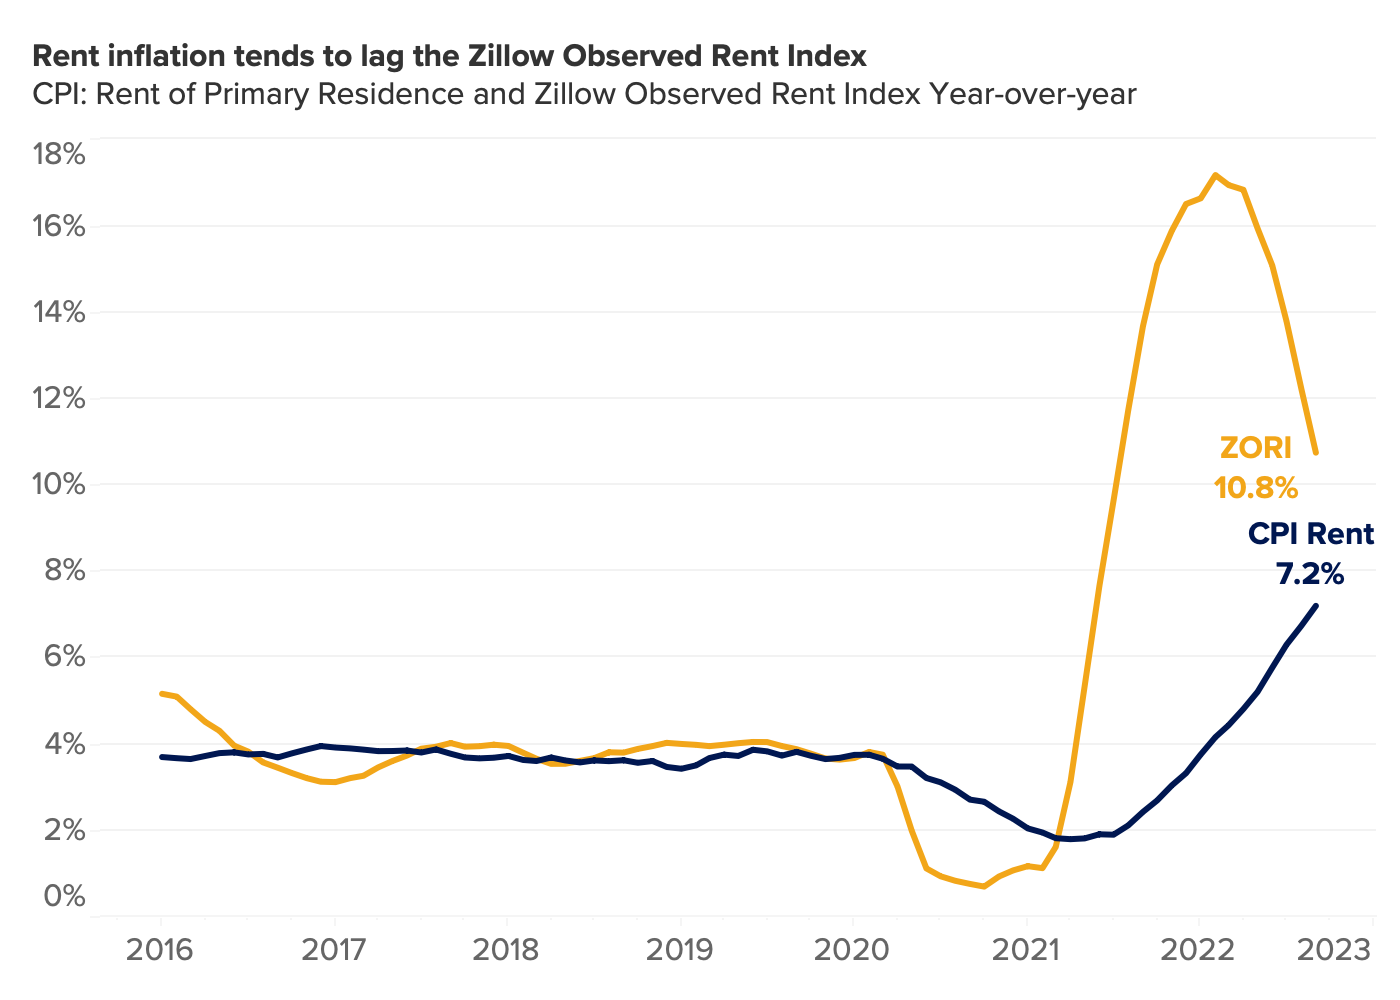
If we look at the CPI for Rent post-2020, we can see how rents rose sharply in 2021-2023. This increase is believed to be due to supply constraints and increased post-pandemic demand. Vacancy rates were low in 2021-2023. In 2024-2025, asking rents stabilized or even fell in some markets, but the CPI Rent will probably not truly reflect this until 2026 and onward, due to the lagging nature of this index.
The Zillow Observed Rent Index (ZORI)
The Zillow Observed Rent Index (ZORI) is a repeat-rent index that measures the typical market rate rent across a given region, weighted to reflect the rental housing stock.
Zillow is a major online real estate platform used by people who wish to buy, sell, rent, or finance homes. Founded in 2006, it is one of the most visited real estate websites in the U.S.
ZORI is based on price data sources directly from the Zillow retanl listings database, i.e. listings of rental properties posted on Zillow. It is thus based on asking rents, not actual rents. ZORI reflects what landlords are asking, not what tenants ultimately pay. Weighting data comes from the American Community Survey.
ZORI is not comprehensive of the entire rental market, since it excludes all rentals not listed on Zillow. It is important to take into account that nany subsidized rentals and rent-controlled units are not marketed on Zillow.
ZORI is exclusively focused on the United States rental market, since the U.S. is the focus of Zillow. ZORI is calculated at national, metro, city, county, and ZIP levels.
Der qualifizierte Mietspiegel für Berlin
Der qualifizierte Mietspiegel für Berlin (The qualified rent index for Berlin) is a legally recognized rent index that plays a central role in regulating rental costs in Berlin, the capital of Germany. This index sets reference levels for various apartment types and is used to determine of a new rent, or a price hike for an existing lease, is legal under German tenancy law.
The index provides base rent values (excluding heating and utilities) per square meter for various types of rental units. Examples of factors that come into play are year of construction, location quality (simple, medium, good), and features such as elevator and modern heating. A system with rent adjustment points allow for fine-tuning.
The index is regulated under § 558d of the German Civil Code (BGB). Before it can be put into force, it must be recognized by the Berlin city government, tenant associations, and landlord organizations. The index is updated every two years, and is based on representative surveys of thousands of actual rents in Berlin. At the time of writing, the version that is currently in force is the one published on May 30, 2024. Since the index is based on past survey data, and only updated every two years, it is not very good at rapidly reflecting changes and trends in the rental market.
Index Volatility and Interpretation
A high-frequency rent index based on listings may show large swings over short periods. For example, in a city with low vacancy and high turnover, rents might appear to rise 5% in a single quarter due to a small shift in the mix of units on the market. That does not mean that existing tenants are suddenly paying 5% more. It means that new leases, for a subset of available properties, are being priced that way. Without controlling for unit characteristics (square footage, amenities, location, etcetera) index values can be misleading.
In contrast, indexes based on in-place leases tend to move slowly, often just 1–2% per year, even in fast-growing markets. This can understate how quickly affordability is deteriorating for new renters. Policymakers relying on these figures might delay interventions, believing the market is stable when it is not.
Because of this, different stakeholders prefer different index types. Government agencies tend to rely on contract-based or survey-based indexes for official reporting. Private equity landlords, rent underwriters, and asset managers prefer listing-based indexes for market-timing and valuation.
Geographic Scale and Comparisons
Rent indexes are typically published at the city or metro level, but granularity varies. A national rent index might show modest growth, while individual cities diverge wildly. For instance, if rents in major urban centers fall due to out-migration, but smaller regional cities rise due to displaced demand, the national index might show minimal movement, masking significant disruption at the local level.
In some markets, zip-code or neighborhood-level indexes are available, especially from private data firms. These allow for micro-level analysis, but their accuracy depends on data volume and quality. Sparse listing data in suburban or rural areas makes it harder to produce stable indexes without smoothing, and that smoothing process can erase local spikes.
Index comparisons across cities or countries are difficult. Rent control policies, tenancy laws, seasonal leasing cycles, and housing stock quality vary too widely. An 8% rent increase in Berlin does not mean the same thing as 8% in Houston or Seoul. Currency movements, mortgage availability, and construction regulation further distort comparisons. Even within a country, comparing one metro area’s rent index to another requires adjusting for the composition of rental units, housing stock age, and local job markets.
Limitations and Distortions
All rent indexes are approximations. They rely on limited, and sometimes biased, data. None can fully capture informal arrangements, under-the-table rentals, or units rented through personal networks. In many regions, especially those with weak regulation, landlords may set prices flexibly based on perceived tenant ability to pay, not listed rents or comparable units. This behavior introduces noise into any index.
Indexes also fail to capture non-price shifts. For example, if landlords stop including utilities, or begin charging for amenities that were once free, headline rents may remain stable while actual tenant costs rise. If lease terms shorten or security deposit requirements increase, affordability declines even if the rent index shows no change.
Lastly, many indexes have revision policies. Early release data is published, then later revised once more complete information is available. This makes short-term figures risky to rely on without context or a long view.
How to Use a Rent Index to Invest in Real Estate
A rent index can be a useful tool for real estate investors. It doesn’t tell you where to buy, what to pay, or which property to pick. What it does offer, if read and interpreted correctly, is context. It can give you a directional view of how rents are trending in a specific area over time. That trend, in combination with local fundamentals, can help you decide where capital is more likely to generate reliable, inflation-adjusted returns.
Rent indexes (also known as rent indices) are not predictive; they don’t forecast rent growth. They measure either what landlords are asking for (but might not be getting) or the rent stated in existing leases. Still, the pace, consistency, and volatility of these movements (especially over multi-year periods) can help investors filter cities, neighborhoods, or submarkets based on rental performance. Specialized new tenant indices can also be better at catching new trends, and can therefore be a useful complement to other rent indices.
When used properly, rent indices can form one layer in a larger investment filter. They should not be considered standalone indicators. Instead, they should be one of several filters used when evaluating a real estate market. They do not replace boots-on-the-ground knowledge, nor do they negate the need for property-level underwriting. But they can help narrow the field, so instead of chasing cities based on media buzz or personal opinion, investors can sort markets by rent index performance and focus on those that have historically shown income resilience.
Using rent indices this way is especially common among long-term investors, institutional buyers, and portfolio builders who need stability more than outperformance. Rent indexes can’t predict sudden market turns, but they can reveal useful information about pricing power, tenant demand stickiness, and income stability. In the absence of perfect data, those signals matter.
There are also a large number of other financial indicators that can help you decide whether or not to invest in a property despite them not being real estate related. Different platforms offer visual tools and macro context for financial trends—though primarily focused on equities, currencies, and commodities. As an example, sites like Daytrading,com provide historical charts and sentiment analysis that, while not rent‑specific, can offer ideas about economic cycles or inflationary pressures that might inform real estate timing decisions
Framing Your Investment Strategy Around Rent Data
If you’re buying income-generating residential real estate (whether a single-family home, a small multifamily, or a larger rental asset) your core risk is income stagnation or loss. If the rent you can charge does not grow at or above inflation, your yield erodes over time. That’s true whether your financing is fixed-rate or not.
A rent index offers a macro snapshot of whether a market historically produces rental income growth. That growth might be lumpy. It might be driven by specific shocks. But over a long horizon, a stable upward trend signals that demand has historically outpaced supply. If that pattern continues, an investor in that market has a better chance of achieving long-term yield growth.
In contrast, if an index shows stagnant or highly volatile rent performance, it signals that the rental market may be more supply-sensitive or economically fragile. Rents may surge during booms, but they fall hard in downturns. That volatility erodes returns when vacancies rise or turnover (with associated costs) increases.
Macro indicators like inflation expectations, bond yields, and broader economic sentiment can help put local rent trends in context. While rent indices tell you how local pricing moves, platforms like investing.co.uk offer access to economic calendars, inflation forecasts, and interest rate updates that can help shape your broader investment outlook.”
Phoenix – A Real-World Example of a Volatile Renting Market
One example of an area where the rental index clearly shows us that we are dealing with high volatility is the Phoenix metro area. Phoenix is the capital and most populous city of the U.S. state of Arizona, and is also the most populous of all the U.S. state capitals. Between 2020 and 2025, Phoenix´s population grew from 1.6 million to an estimated 1.8+ million, further solidifying Phoenix´s position as the fifth most populous city in all of the United States.
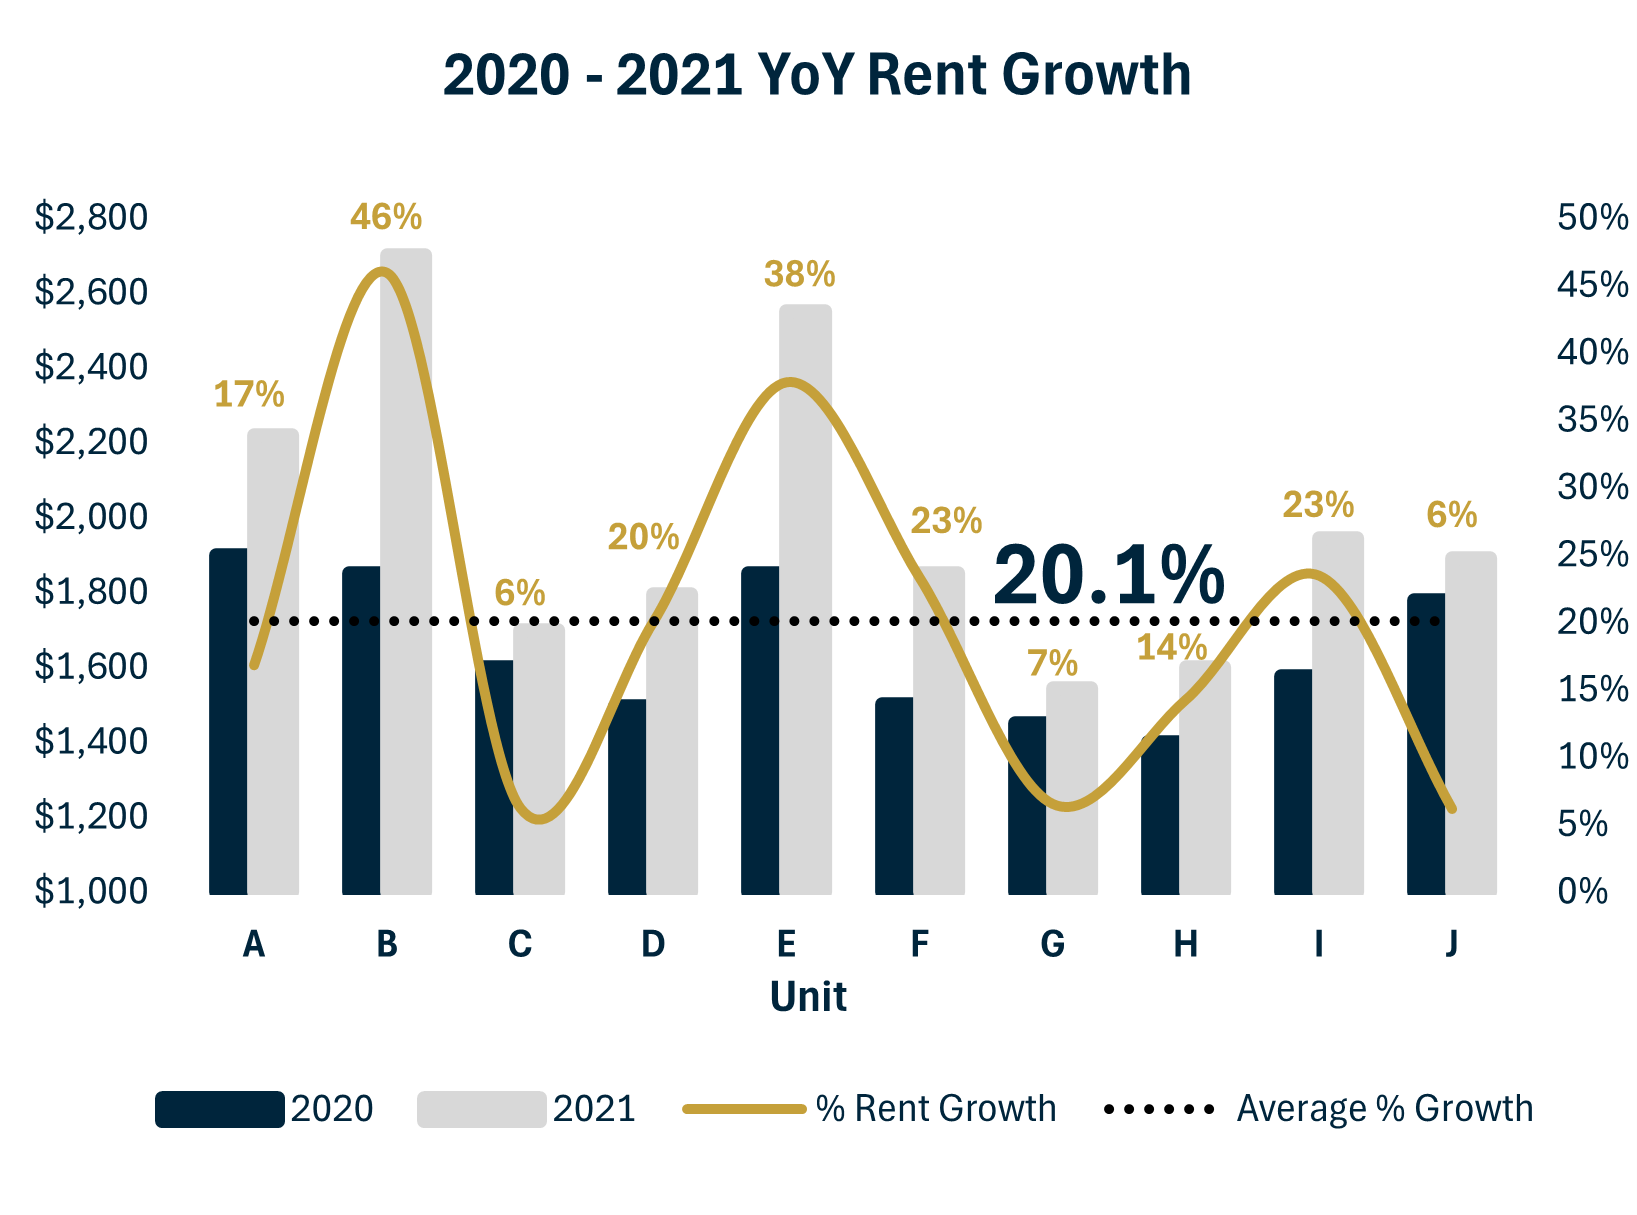
Just like many other parts of the United States, Phoenix saw sharp rent spikes in 2021-2022. During this period, the year-over-year rent growth in single-family rentals reached over 30% at times, but it was not a gradual increase, as the monthly numbers swung widely. If we look at the Zillow Observed Rent Index (ZORI), we can see how on-market rents in Phoenix peaked in 2021, but off-market and aggregate rents continued to increase even after this, as tenant turnover occurred. Still, 2022 marked the beginning of a massive cool down as the market adjusted to the new post-pandemic environment.
If we take a step back and look at pre-pandemic times, central Phoenix had a fairly stable rental market in 2016-2017, while price booms were taking place in suburban neighborhoods such as Goodyear, Glendale, and Mesa. The rent was on the rise in central Phoenix as well, but in a much more slow and gradual manner.
Generally speaking, the rental indices for Phoenix show a tendency for explosive growth followed by quick corrections. Fast building tend to lead to oversupply and concessions, and a prospective investor need to model both upside and downside scenarios. In October 2023, a Zillow-surveyed Phoenix listing report showed that roughly 45% of Phoenix-area rental listings included some kind of incentive, e.g. parking perks or waived fees, compared to roughly 30% a year earlier.
The strong boom-and-bust cycles in Phoenix are not only driven by fast building; they are believed to stem from a combination of many factors, including demographic shifts and investor activity. Phoenix is currently one of the fast-growing cities in the U.S., with a lot of the new residents moving in from California, the Midwest, and certain other high cost of living (HCOL) regions within the United States. We also need to take into account that the job market in Phoenix is heavily tied to construction, so when construction calms down after a boom period, the sudden lack of jobs in construction intensifies the general downturn. As jobs falter, renter demand and rent payment strength drop quickly.
In 2020-2022, Wall Street-backed firms purchased thousands of homes in Phoenix, converting many of them into rentals. This was in line with the general trend of Phoenix being a favorite city for out-of-state investors. The 2020-2022 purchases and conversions added more rental units to the market, which then turned into an oversupply as demand cooled down.
Using Rent Indices to Filter Markets Based on Rent Trends
Suppose you’re choosing between two cities with similar price-to-rent ratios and population growth rates. One has had consistent rent index growth of 3% annually for the last decade. The other has had flat growth, with occasional spikes and drops. If all other variables are equal, the first market has stronger rental pricing power. That matters more than headline property prices, because income durability is what drives long-term real estate returns.
A rent index can also help identify mispriced neighborhoods. If rent growth in a specific submarket is outpacing the broader metro area, and property prices haven’t yet caught up, there may be an opportunity to buy into rental cash flow at a discount. These pockets don’t last long (capital usually finds them quickly) but they’re often visible in rent index data before they show up in mainstream investor reports.
Timing Acquisitions and Underwriting Expectations
Rent indexes help set realistic expectations for underwriting. If the historical trend shows 2.5% annual rent growth, baking 5% into your year-one forecast is speculative. Too many investors build pro forma models using optimistic rent growth assumptions pulled from listings, broker pitches, or anecdotal trends. Using a local rent index can impose some discipline, by forcing the underwriting to stay grounded in observed market performance, not abstract potential. This is especially important when operating with leverage. If a loan’s debt service coverage ratio is sensitive to future rent growth, betting on 4% when the last five years delivered 1.5% is risky. The index doesn’t eliminate that risk, but it exposes it. Knowing how much rent would need to grow to hit target yields gives the investor a clearer sense of margin.
Evaluating When to Sell
Rent indexes can also be used in reverse, i.e. to determine when a rental asset may have topped out in income performance. If index growth flattens across a metro area and your own lease renewals are stalling, it may be time to reconsider the hold period. In hot markets, rents often overshoot fundamentals. A surge in rent index values over a one- or two-year period may look like a reason to buy, but it can also signal that a cycle is peaking. If the supply pipeline is growing or economic growth is slowing, that spike might fade.
Note: For long-term investors, chasing top-of-market rents is rarely worth the risk. A high rent index today doesn’t guarantee higher rents tomorrow; it just means prices are already elevated.
It is Important to Adjust for Index Composition
Not all rent indexes are created equal. When using them to guide investment decisions, it’s important to understand what they actually reflect. How data is collected, how the index is weighted, how frequently it is updated, and what this specific index is aiming to show are all important factors to consider. Many national indexes are for instance weighted toward urban, professionally managed units. They may not reflect rents in smaller buildings or less dense neighborhoods. If you’re buying Class B or C properties in secondary markets, a metro-wide index may not tell you much. You’ll need to look for submarket-level data or use the index as a rough directional proxy. If the market rent index shows 2.5% annual growth and your building class typically trails by 1%, you can at least model with more accuracy than if you had no reference at all.
Also, remember that some indices are built on asked rents while others are based on actual rents for existing leases. Indices built on asking prices tend to exaggerate growth in rising markets and understate it in soft ones. They show what landlords are asking, not what tenants are paying. In hot rental markets, landlords often ask a high price, but there is no guarantee that they will always get it, despite the hotness of the market. In weak markets, they may still ask high, but include incentives that don’t show up in the headline rent. It is often better to use advertised rent indexes (asking price rent indexes) as momentum signals, not as pricing benchmarks.